What does "visualization" mean?
When we use the word "visualization" on this site, we mean a set of interactive graphs and charts created using the Tableau system.
These visualizations are built using data that is collected on MPS schools, staff, and students.
All charts and graphs on this site are interactive, which means that you can click on them and change their inputs to get more detailed information about the data being displayed.
How to use visualizations
The most common way that you will probably be using these visualizations is to ask a data-driven question about specific schools or populations of students.
As an example, maybe you want to compare MCA Reading scale scores for African American and white students across the district.
To find the answer, you would follow these steps:
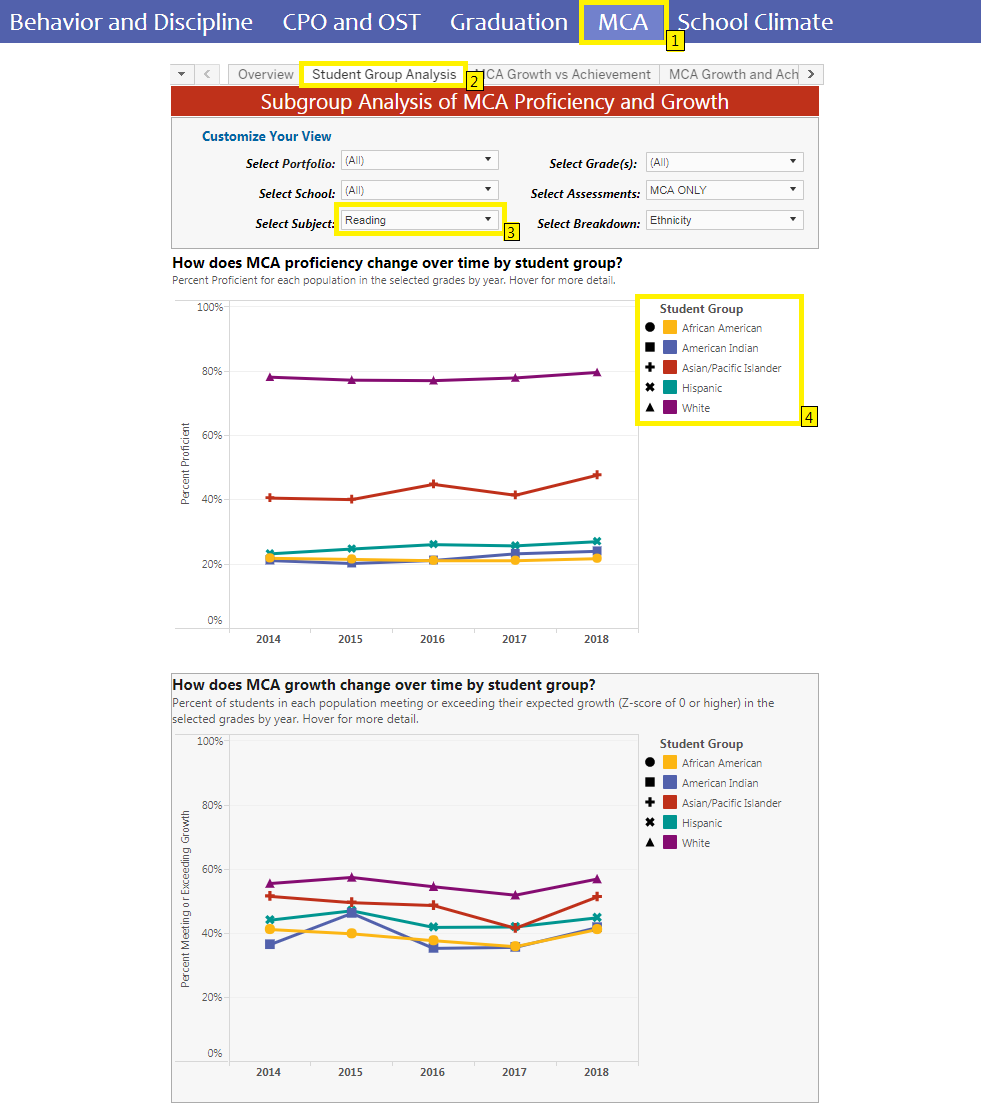
- From the Home page of this site, click on MCA in the blue navigation bar.
- Once the visualization has loaded, click on the Student Group Analysis tab of the gray menu bar.
- Use the menus in the gray box labeled "Customize Your View". In this case, to see Reading scores, select "Reading" from the drop-down menu labeled "Select Subject".
- To view numbers for a specific group, you can click on that group's name in the color legend to the right of the chart. You can also get both the percent proficient and the number tested by hovering over a data point in the chart.
See the image below for a visual representation of these steps: